
A Study on Automated Essay Scoring with Large Language Models: Effects of 4-bit QLoRA Quantization on Reliability and Score Distribution Characteristics
Abstract
This study aims to identify the underlying causes of performance degradation observed in 4-bit quantized QLoRA-based large language models applied to automated essay scoring (AES). To this end, we design a staged experimental framework consisting of four analytical dimensions: accuracy performance, output stability, output distribution characteristics, and disentanglement of performance degradation causes. Using this framework, we conduct a comparative analysis between a BF16 baseline model and 4-bit quantized QLoRA models. Experimental results show that the observed accuracy degradation in quantized QLoRA models is not attributable to output pipeline errors, but is closely associated with structural collapse in the output score distribution. While increasing the QLoRA rank leads to partial improvements in certain accuracy metrics, it does not fundamentally mitigate the distributional collapse. These findings demonstrate that, in the evaluation of lightweight LLM-based AES systems, assessment should extend beyond average accuracy metrics to explicitly incorporate the stability and structural properties of output score distributions.
초록
본 연구는 4-bit 양자화 QLoRA 기반 대규모 언어모델 자동 에세이 채점(AES)에서 관찰되는 성능 저하의 원인을 규명하는 것을 목적으로 한다. 이를 위해 정확도 성능, 출력 안정성, 출력 분포 특성, 성능 붕괴 원인 분리의 네 범주로 구성된 단계적 실험 프레임을 설계하였고, BF16 기반 모델과 4-bit 양자화 QLoRA 모델을 비교 분석하였다. 실험 결과, 양자화 QLoRA 모델의 정확도 저하는 출력 파이프라인 오류가 아닌 출력 점수 분포의 구조적 붕괴와 밀접하게 연관됨을 확인하였다. 또한 QLoRA rank 증가가 일부 정확도 지표를 개선하였으나 분포 붕괴를 근본적으로 완화하지는 못하였다. 본 연구는 경량화 LLM 기반 AES 평가에서 평균 정확도 지표를 넘어 출력 분포 안정성을 함께 고려해야 함을 실증적으로 제시한다.
Keywords:
Computer Education, AES, LLM, Model Quantization, Output Distribution Analysis, QLoRA키워드:
컴퓨터 교과교육, 자동 에세이 채점, 대규모 언어모델, 모델 경량화, 출력 분포 분석1. Introduction
Automated Essay Scoring (AES) has evolved as a core technology for reducing scoring time and cost in large-scale educational assessment settings, while enhancing the fairness and consistency of evaluation outcomes. Early AES systems were primarily developed by applying regression models to manually engineered linguistic features or word-level statistical information. More recently, however, LLM-based AES approaches that leverage the contextual understanding and text generation capabilities of Large Language Models (LLMs) have attracted increasing attention[1–3]. These approaches improve scalability and applicability by delivering scoring criteria and rubrics through prompts and inducing LLMs to generate scores directly.
Nevertheless, prior studies have reported that the performance of LLM-based AES systems is highly sensitive to factors such as prompt design, rubric alignment, and examinees’ linguistic characteristics, and that achieving stable and consistent performance remains challenging[1–3]. In addition, AES is an ordinal prediction task in which score ordering is inherently important. Evaluating scoring performance solely based on a single average metric may therefore fail to adequately explain actual prediction behavior. Accordingly, previous research has emphasized the need for multidimensional evaluation frameworks that center on Quadratic Weighted Kappa (QWK) while also incorporating absolute error–based and rank-preservation metrics[4, 5].
Meanwhile, practical deployment of LLMs in educational assessment requires consideration of real-world constraints such as computational resources and memory consumption. To mitigate these constraints, QLoRA—a parameter-efficient fine-tuning technique based on 4-bit quantization—has been proposed and has gained attention as an alternative that substantially reduces memory usage while maintaining average performance compared to full-precision settings[6–8]. As a result, interest in the practical applicability of low-precision quantized LLMs has continued to grow.
However, existing evaluations of quantization-based LLMs have largely focused on natural language understanding or generation tasks, often relying on average accuracy as the primary performance indicator. In tasks such as AES, where score ranges are constrained and stability in ordinal prediction is critical, such evaluation practices may be insufficient to capture changes in output characteristics. In particular, potential degradation in output stability or shifts in score distributions induced by quantization may not be reflected in single performance metrics, yet can substantially affect the interpretation of scoring reliability[7–9].
Against this background, the present study aims to examine the performance changes of 4-bit QLoRA-based large language models (LLMs) in automated essay scoring (AES) beyond simple comparisons of average accuracy, by adopting a more fine-grained analytical perspective that reflects the characteristics of the AES task. Specifically, this study is designed as a scoped analysis focusing on how scoring outputs undergo structural changes under a representative open-model and lightweight adaptation setting, namely Mistral-7B with QLoRA. Mistral-7B has been widely adopted as a representative 7B-scale open model in terms of both performance and efficiency [10, 11], and recent AES studies have also reported that scoring outcomes can vary depending on the choice of LLMs and prompt design [1, 3, 12]. While the experimental setting is intentionally limited to this representative configuration, it provides a controlled and analytically tractable environment for isolating the effects of low-bit quantization on scoring behavior. Accordingly, rather than aiming for broad generalization across diverse model architectures or quantization schemes, this study systematically investigates accuracy changes, output stability, distributional characteristics, and potential causes of performance degradation within this setting.
Through this focused analysis, we aim to provide quantitative insights into the applicability of lightweight LLMs to AES, as well as to highlight key interpretational considerations when analyzing their outputs under constrained representational capacity.
2. Related Work
2.1 LLM-Based Automated Essay Scoring
Automated essay scoring (AES) based on large language models (LLMs) has gradually expanded as an approach that complements or replaces the limitations of traditional feature-based methods. Early AES studies, particularly those based on neural networks, repeatedly highlighted the need for evaluation metrics that adequately reflect the ordinal nature of score prediction[13]. With the increasing adoption of GPT-family models and open-source LLMs, recent research has focused on directly incorporating the language understanding capabilities of models into the scoring process[13].
Huang and Wilson[1] reported that explicitly rubric-driven prompts improve agreement with human raters, while Li et al.[2] showed that correlations between LLM-generated scores and human ratings are generally moderate or higher but vary substantially across conditions. Abujadallah et al.[3] empirically demonstrated that carefully designed rubrics contribute to improved performance stability. As evaluation metrics, Quadratic Weighted Kappa (QWK) is most commonly adopted[5], with RMSE and Kendall’s τ frequently used as complementary measures[4]. This practice reflects the ordinal nature of AES, in which simple accuracy-based comparisons are insufficient to ensure evaluative validity.
2.2 QLoRA-Based Quantization and Output Characteristics
In recent years, low-precision quantization techniques and parameter-efficient fine-tuning methods have been actively studied to enable efficient utilization of large language models. Dettmers et al.[6] demonstrated that QLoRA enables efficient fine-tuning of large-scale models even under 4-bit (INT4) quantization, achieving performance comparable to FP16 settings while substantially reducing memory usage. Subsequently, Liu et al.[7] and Jin et al.[8] compared and analyzed various quantization strategies, noting that while average accuracy degradation is often limited, performance variability may emerge depending on task characteristics.
To improve training stability and performance retention after quantization, Xu et al.[14] proposed QA-LoRA, a quantization-aware low-rank adaptation method that preserves fine-tuning effectiveness under quantized conditions. Proskurina et al.[15] analyzed how quantization can affect model output confidence, while Zhao et al.[16] and Elhoushi et al.[17] reported that learned INT4 representations can contribute to maintaining accuracy. Collectively, these studies suggest that low-precision quantization influences not only computational efficiency but also broader output characteristics of models.
However, most quantization- and QLoRA-based studies have focused on natural language understanding or generation tasks. When applied to ordinal prediction tasks such as AES, comprehensive validation encompassing output stability, score distribution distortion, and sensitivity to input characteristics remains limited[18, 19]. In tasks like AES, where score ranges are constrained and evaluation criteria are strict, average accuracy metrics alone are insufficient to fully explain prediction behavior.
Output variability, distributional concentration, or distortion arising in quantized environments may not be reflected in single performance indicators, thereby limiting the interpretation of scoring reliability. While existing quantization studies implicitly suggest the need to jointly consider output distributions and reliability in sensitive evaluation tasks such as AES, systematic investigations in this context remain scarce.
Furthermore, 4-bit quantization-based QLoRA has been widely recognized as a representative lightweight approach that simultaneously seeks memory efficiency and performance preservation [6]. Research on LoRA and its variants has consistently evolved around parameter-efficient fine-tuning strategies grounded in low-rank adaptation [20–22]. In particular, LoRA-Pro analyzes LoRA from the perspective of low-rank gradient approximation, explicitly formulating the problem under low-rank constraints and developing its methodology within this regime [21]. This line of research suggests that the critical question in lightweight adaptation is not whether higher ranks can recover full capacity, but rather to what extent low-rank configurations—under strict representational constraints—can retain performance and expressive power in practice [20–22]. Accordingly, examining model behavior within the low-rank regime constitutes a meaningful and well-motivated analytical setting for understanding the practical limits of parameter-efficient adaptation.
2.3 Output Collapse and Distributional Analysis
Reductions in output diversity of LLMs may directly affect AES performance, motivating increasing interest in the quantitative analysis of output distribution characteristics. Duym et al.[9] proposed Mode Collapse Entropy (MCE), an entropy-based metric designed to quantify reductions in output diversity. Decreases in entropy indicate a concentration of generated outputs toward specific responses, a phenomenon that is not captured by average performance metrics alone[9]. Distribution shift measures such as PSI and KL divergence have also been reported as useful tools for evaluating changes and stability in output distributions[4].
Nevertheless, these distributional analysis metrics have primarily been applied to diagnose general properties of generative models. Studies that systematically connect accuracy metrics with distributional characteristics in sensitive prediction tasks such as AES remain limited. Existing LLM-based AES research has largely focused on agreement with human raters or on single average performance indicators[1-2]. While such approaches facilitate straightforward performance comparisons, they provide limited insight into the structural properties underlying model outputs. Li and Ng[13] similarly highlighted the limitations of evaluation practices centered on single performance metrics in recent surveys of AES research.
As a result, it becomes difficult to determine whether observed performance degradation in AES stems from increased prediction error or from structural changes such as reduced output diversity or distributional shifts. This limitation is particularly salient in ordinal scoring tasks, where average or single agreement metrics fail to adequately reflect changes in score distribution shape[4-5], thereby constraining systematic analysis of how distributional properties relate to scoring performance.
2.4 Analysis of LoRA Learning Effect Retention
LoRA is a parameter-efficient fine-tuning method that allows quantitative assessment of learning adaptation through analyses of weight change magnitudes (ΔW_norm). Hu et al.[20] demonstrated effective fine-tuning of GPT-3 using LoRA, while Wang et al.[21] improved optimization efficiency through LoRA-Pro, and Zhou et al.[22] confirmed performance retention using the LoRA-drop technique. These studies collectively indicate the importance of quantitatively tracking learning dynamics beyond surface-level performance metrics.
2.5 Length Bias and Sensitivity to Lexical Diversity
Ravindran and Choi[23] pointed out that AES models can exhibit excessive sensitivity to input length and lexical level, potentially distorting evaluation criteria. Atkinson and Palma[18] criticized tendencies to rely on sentence complexity rather than structural coherence and proposed hybrid approaches as an alternative. Hou et al.[19] and AlGhamdi et al.[24] explored prompt-based adjustments incorporating lexical diversity to mitigate length-centered bias.
3. Methods / Experimental Design
3.1 Study Overview and Experimental Design
The experimental design of this study aimed to systematically decompose and verify the underlying causes of performance degradation observed in 4-bit quantized QLoRA-based LLM-AES systems. Rather than relying on single-metric comparisons, the experiments were structured to sequentially exclude potential causes of degradation and to examine them from a structural perspective.
Specifically, the analysis first examined differences in Accuracy Performance, followed by an evaluation of output validity to exclude explanations attributable to inference pipeline artifacts. Subsequently, output score distribution analysis was conducted to identify potential structural changes, and finally, comparisons across QLoRA ranks were performed to assess the contribution of learning effects. This multidimensional analytical framework was designed to interpret AES performance changes observed under 4-bit quantization not as simple metric degradation, but as changes in output structure. Accordingly, AES performance was analyzed along four analytical axes: Accuracy Performance, Output Stability, Output Distribution Characteristics, and Disentanglement of Performance Degradation Causes.
For Accuracy Performance, prediction agreement between the BF16(baseline) model and 4-bit quantized QLoRA models (r = 8, r = 16) was compared using ordinal evaluation metrics. As these results alone were insufficient to identify the causes of performance changes, further experiments were required to exclude potential errors arising from output generation and post-processing.
To this end, Output Stability analysis diagnosed phenomena that may occur in quantized LLM environments—such as out-of-bound scores, clamping, and retries—using QA Gate indicators. This approach enabled analysis of accuracy degradation as a structural characteristic of the output generation process, rather than attributing it to simple errors.
As residual phenomena remained unexplained by pipeline-level analysis, Output Distribution Characteristics were subsequently examined. Based on the premise that output distributions may differ even when average performance appears similar, entropy, KL divergence, and PSI were used to evaluate changes in output distributions, including distortion and collapse, that are not captured by accuracy comparisons alone.
Finally, to determine whether observed performance changes under quantization were attributable to the presence of LoRA adapters or to structural constraints on learning signal propagation and representation induced by quantization itself, experiments were designed for Disentanglement of Performance Degradation Causes.
3.2 Comparison Model Configuration
The base model used in this study is Mistral-7B-Instruct v0.2. Among publicly available 7B-scale models, Mistral-7B has been reported to provide reliable reasoning performance and stable handling of long-context inputs, which are essential for automated essay scoring (AES) tasks [10, 11]. The primary objective of this study is not to compare performance rankings across multiple models, but to conduct a controlled analysis of how 4-bit quantization and QLoRA adaptation affect the structural properties of AES output distributions. In this context, employing a single representative base model allows for isolating the effects of quantization and adaptation without introducing additional variability stemming from architectural differences. The model was loaded using the Hugging Face Transformers framework, while pretrained components such as the tokenizer, attention mechanisms, and positional embeddings were preserved
As summarized in Table 1, four comparison models were defined and used throughout the experiments. Hereafter, model indices ①, ②, ③, and ④ refer to the definitions provided below.

Experimental Conditions and Definition of Comparison Models
The BF16(baseline) model served as the reference condition without quantization or adapter-based training, and all subsequent comparisons were conducted relative to this model. The INT4 (Adapter OFF) model was configured to use quantized representations only and was included as a control condition to isolate the effects of quantization itself on output accuracy and distributional characteristics. The two QLoRA-based models (INT4+QLoRA r = 8 and r = 16) were designed to examine whether performance changes consistently reflect differences in adapter training and rank settings under identical quantization conditions. In line with the objective of prioritizing practically deployable lightweight configurations for real-world educational assessment settings, this study restricts its analytical scope to a representative 4-bit QLoRA setup and the low-rank regime (r = 8 and r = 16). QLoRA has been widely recognized as a well-established approach that simultaneously pursues memory efficiency and performance preservation under 4-bit precision [6], and LoRA-based methods have consistently evolved within the framework of parameter-efficient fine-tuning grounded in low-rank adaptation [20–22]. Prior studies also discuss the trade-off between efficiency and performance under low-rank constraints as a central design consideration [20, 22]. Accordingly, rather than exploring higher-rank configurations aimed at recovering full model capacity, this study focuses on how low-rank adaptation behaves under strict representational constraints, and to what extent such configurations can maintain scoring reliability and distributional diversity in AES. To this end, rank values of 8 and 16 were selected as analytically meaningful points within the low-rank regime to examine their impact on score distributions and scoring stability.
To mitigate post-quantization performance degradation, additional confirmation experiments were conducted by applying tuning strategies reported in prior studies, with detailed tuning conditions provided in the Appendix. This experimental step was included to analyze the impact of quantization on AES performance in cases where tuning was applied yet performance degradation persisted. Through comparisons across the four models, observed performance changes were analyzed stepwise to determine whether they stemmed from precision loss, the presence of adapters, or differences in LoRA representational capacity.
3.3 Dataset and Evaluation Setup
For AES performance comparison, the publicly available benchmark dataset ASAP-AES (Automated Student Assessment Prize – Essay Scoring) was used. This dataset was collected from a Kaggle competition held in 2012 and has been widely adopted as a baseline in recent LLM-based AES research. Its diverse prompt configurations and score scales make it suitable for evaluating generalization and fairness in scoring models[13].
The ASAP-AES dataset consists of eight prompt sets, each with different score ranges. To enable comparison on a common scale, scores were normalized based on the minimum and maximum values for each prompt. Preprocessed data were organized in JSONL format and subsequently processed in a fixed sequence—file organization, prompt separation, and generation of score and bias groups—to ensure To prevent data leakage across prompts, a prompt-disjoint evaluation setting was applied. Prompts 1–6 were used for training, while prompts 7 and 8 were reserved as unseen test samples and used consistently across all models to ensure fair comparison. Considering the characteristics of AES tasks, model output scores were evaluated against predefined score ranges. Cases involving out-of-range outputs or clamping were recorded separately, enabling analysis of how technical factors in the inference pipeline influence performance.
To ensure reproducibility, all experiments were conducted using a unified scoring prompt shared across all models. Each model was assigned the role of an evaluator using the instruction “You are an expert essay scorer,” and the valid score range for each essay set was explicitly specified within the prompt. Model outputs were strictly constrained to return a single integer score within the predefined range using the instruction: “Return ONLY ONE integer in the range [lo, hi]. No JSON. No words. No explanation. No extra tokens.” The scoring protocol follows the official ASAP-AES scoring scheme for each essay set. Instead of embedding full-length rubric descriptions, which may introduce unnecessary variability, the prompt incorporates a set of evidence-based scoring guidelines—such as “Do NOT default to the middle score,” “Use the FULL score range when appropriate,” and “Choose a score based on evidence in the essay”—to guide consistent scoring behavior while preserving prompt simplicity and reproducibility. In addition, for unseen evaluation settings (prompts 7 and 8), limited few-shot examples were selectively introduced during retry steps only when necessary. These examples provide boundary cases, illustrating how extremely low- and high-quality responses should be scored, thereby stabilizing model outputs under extreme conditions without altering the overall prompt structure.
3.4 Evaluation Metrics
Evaluation metrics were organized in alignment with the stepwise validation objectives of this study and were grouped into four categories:
(A) Accuracy Performance metrics,
(B) Output stability(Inference pipeline QA metrics),
(C) Output Distribution Characteristics metrics, and
(D) Disentanglement of Performance Degradation Causes metrics.
First, for Accuracy Performance, QWK (weighted, macro), RMSE, and Kendall’s τ (along with prompt-wise QWK and ΔQWK) were used to capture agreement and error in ordinal score prediction.
Second, Output Stability was assessed using score-based QA Gate metrics only—specifically OOR rate, CSR_total, clamp impact, and raw vs. clamped accuracy drift—to refute explanations based on simple output errors or post-processing artifacts, without relying on asymmetric information such as raw text logs.
Third, for Output Distribution Characteristics, entropy, MCR, and variance were used to directly measure diversity, concentration, and dispersion in output scores. To summarize collapse severity into a single value, CPI-lite (z(MCR) − z(Entropy) − z(Var)) was employed as an auxiliary indicator.
Fourth, for Disentanglement of Performance Degradation Causes, learning attribution indicators based on Adapter ON/OFF comparisons—AEC_change_rate, Δmean(|pred|), rank sensitivity, length bias correlation, and vocabulary richness proxy—were used to distinguish between learning failure and representational limitations induced by INT4 quantization. LoRA ΔW norm was additionally used as a supplementary indicator to confirm whether learning had occurred.
Output distribution characteristics were additionally examined using entropy, MCR, and CPI-lite, where entropy captures score diversity, MCR indicates the largest concentration in a single score bin, and CPI-lite provides an auxiliary summary of collapse tendency.
3.5 Comparison Axes and Analysis Scope
Although different evaluation metrics were applied at each analytical stage, all analyses were conducted using identical model outputs and evaluation samples. Accuracy Performance analysis focused on score agreement and ordinal preservation, Output Stability analysis emphasized out-of-range scores and clamping behavior, Output Distribution Characteristics analysis quantified score concentration, shifts, and collapse, and Disentanglement of Performance Degradation Causes analysis was conducted through comparisons across QLoRA configurations.
3.6 Statistical Significance Testing
To quantitatively compare the effects of 4-bit quantization and QLoRA-based fine-tuning on AES performance, this study statistically verified whether observed performance differences represented systematic effects rather than random variation. As AES involves ordinal response variables and includes QA gate procedures such as score range constraints and clamping, simple comparisons of average performance metrics are insufficient to fully justify model differences.
Accordingly, paired model predictions for identical essays were constructed, and non-parametric tests were applied to minimize reliance on distributional assumptions. Statistical testing was conducted using clamped prediction scores obtained from unseen evaluation prompts (prompt_7 and prompt_8), with all comparisons fully aligned at the essay_id level. Model pairs included BF16(baseline) vs. INT4 (Adapter OFF), and BF16(baseline) vs. INT4+QLoRA (r = 8, r = 16).
The Wilcoxon signed-rank test was used for statistical significance testing, with all tests conducted as two-sided tests at a significance level of α = 0.05. To assess the practical magnitude of observed differences, effect sizes were computed using the Vargha–Delaney A statistic.
4. Results and Analysis
4.1 Accuracy Performance Analysis
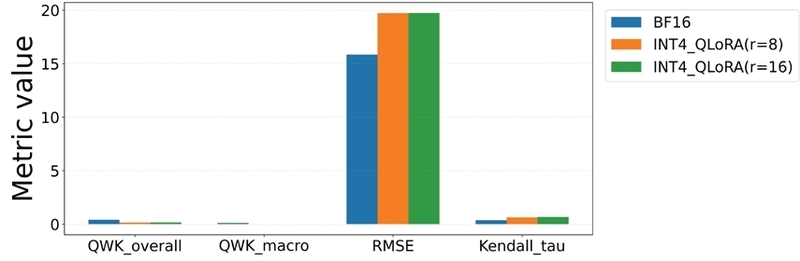
The overall QWK of the BF16(baseline) model was 0.4056. In contrast, under INT4 + QLoRA configurations, QWK values decreased substantially to 0.1513 for r = 8 and 0.1565 for r = 16, as summarized in Table 2.
Summary of Accuracy Results
A similar trend was observed for RMSE. Compared to the BF16 baseline (RMSE = 15.83), RMSE increased to 19.719 for r = 8 and 19.731 for r = 16, indicating an overall increase in prediction error under quantized conditions (Fig. 1).
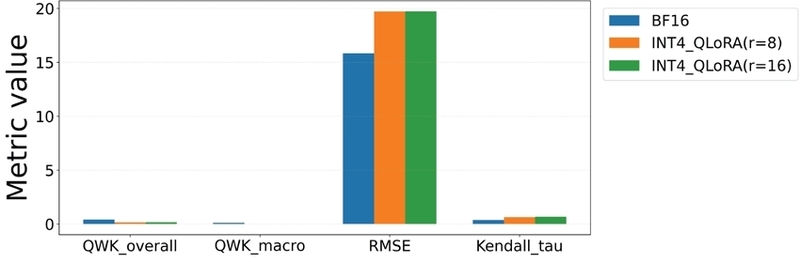
Comparison of Accuracy Performance
In contrast, Kendall’s τ exhibited a different pattern. Although absolute score accuracy deteriorated, relative ranking information was partially preserved in the INT4 + QLoRA models. This suggests that while predicted scores deviated from ground truth values, ordinal relationships among essays were not entirely lost.
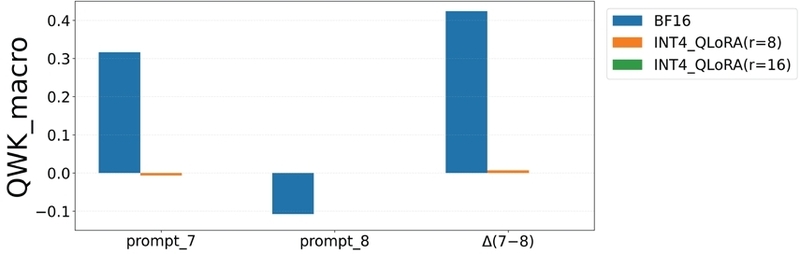
Prompt-wise sensitivity analysis revealed a similar trend. As shown in Table 3, the BF16 model exhibited substantial variation in QWK_macro across prompts, with values of 0.316 for prompt_7 and -0.108 for prompt_8 (|Δ| = 0.424). In comparison, INT4 + QLoRA (r = 8) yielded a QWK_macro of 0.007, and INT4 + QLoRA (r = 16) yielded 0.000, indicating almost no performance variation across prompts (Table 3, Fig. 2).
Prompt Sensitivity Analysis Based on QWK_macro
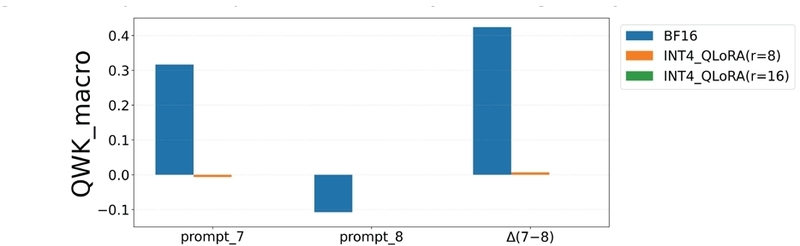
Prompt-wise Variability in Accuracy
These results demonstrate that accuracy degradation in 4-bit quantized QLoRA-based AES models was consistently observed. However, based on accuracy metrics alone, it remained unclear whether this degradation originated from technical issues in the inference pipeline—such as score range violations or post-processing artifacts—or from structural changes in model outputs. This uncertainty motivated further analysis using QA Gate indicators to examine output stability and validity.
4.2. Output Stability (QA Gate) Analysis
To examine whether the accuracy degradation identified in the Accuracy Performance analysis could be attributed to technical instability in the inference pipeline, output stability and validity were evaluated using QA Gate indicators.
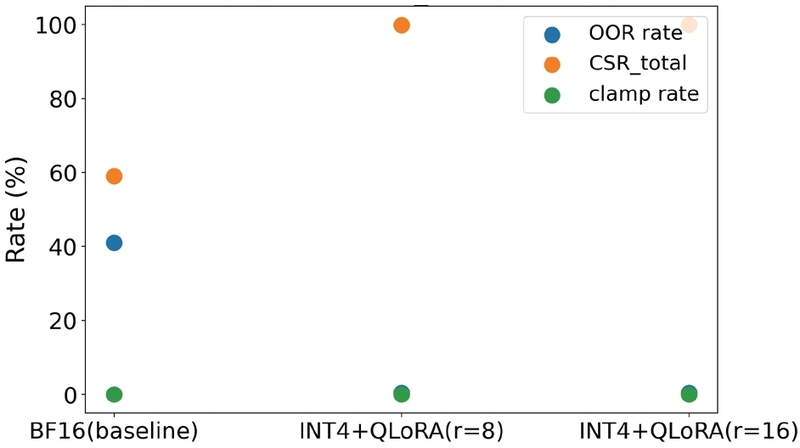
Table 4 quantitatively reports how well each model’s outputs adhered to the official scoring ranges for each prompt, using OOR rate and CSR_total. For the BF16(baseline) model, the overall OOR rate was 41.23%, with prompt_7 and prompt_8 exhibiting OOR rates of 48.38% and 25.73%, respectively. This indicates that approximately one to two out of every four to five predictions fell outside the valid score range, implying frequent violations of the AES task definition.
QA Gate Diagnostic Resultso
The visualization in Fig. 3 clearly supports these numerical differences. The BF16 model exhibited both a high OOR rate and relatively low CSR_total, whereas the QLoRA-based models showed CSR_total values approaching 100% and OOR rates converging to zero, indicating a structural contrast between model types. In Table 4, the clamp rate for INT4 + QLoRA models was reported as 0.000%. This does not indicate clamp failure or measurement error. rather, it reflects that all raw predictions already satisfied the valid score range. Accordingly, this value should be interpreted as evidence of complete output stability rather than as an anomaly.
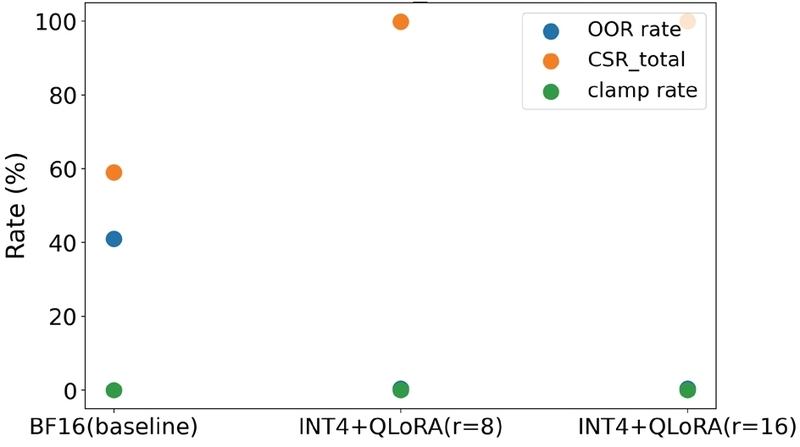
Comparison of Score Range Violations and Clamping Effects Across Models
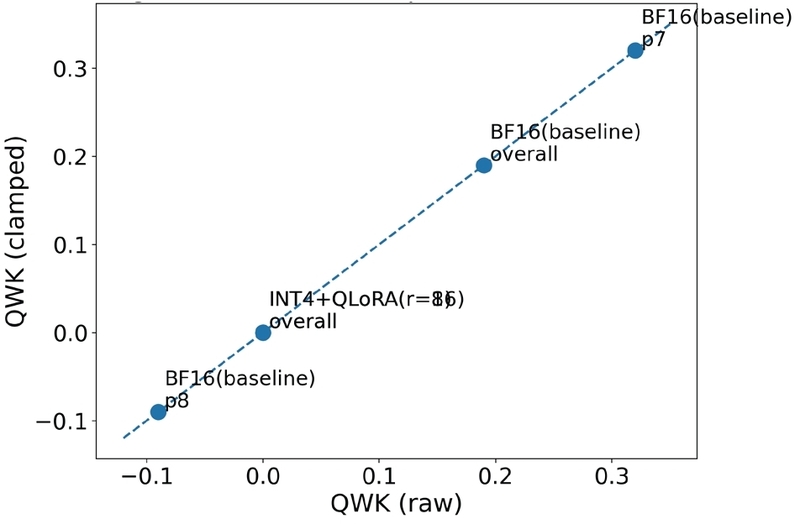
Table 5 presents an analysis of how output stabilization mechanisms—such as clamping and retry—affected performance metrics. The QWK drift and RMSE drift between raw and clamped predictions were 0.000 for all models, indicating that clamping neither distorted nor artificially improved performance metrics, but functioned solely as a safety mechanism.
Output Stability and Retry Diagnostics
Retry events were observed for INT4 + QLoRA models. however, their frequency was extremely low, occurring fewer than once per 1,000 inferences. This indicates that retry mechanisms were activated only in exceptional cases, reflecting normal protective behavior of the inference pipeline rather than evidence of output instability.
Fig. 4 illustrates the relationship between QWK(raw) and QWK(clamped) across models and prompts. All points lay on the diagonal (y = x), confirming that clamping did not alter QWK values under any condition. This observation is consistent with Table 5, which shows zero difference between QWK(raw) and QWK(clamped) across all models and settings, indicating that retry mechanisms did not affect final scoring outcomes.
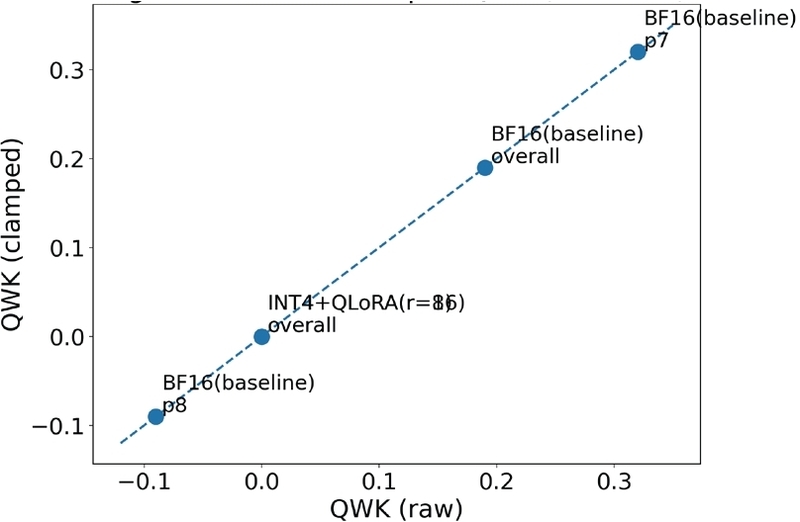
Raw vs Clamped QWK
Overall, the Output Stability analysis confirmed that the accuracy degradation observed in the Accuracy Performance analysis did not originate from technical instability in the inference pipeline. However, to more fundamentally explain the observed accuracy decline, it became necessary to analyze how the structural properties of output score distributions changed across models. This motivated the subsequent analysis of output distribution characteristics.
4.3 Output Distribution Characteristics Analysis
Although the Output Stability analysis confirmed that inference stability was preserved, accuracy degradation persisted. To explain this phenomenon, experiments were conducted to examine the structural properties of output score distributions.
Analysis of output diversity metrics (Table 6) quantitatively revealed how the informational diversity and dispersion of output score distributions changed across models.
Output Diversity Metrics
Entropy values showed that the BF16(baseline) model maintained relatively stable information content across all prompts, indicating that its output distributions retained sufficient uncertainty and diversity.
In contrast, the INT4 + QLoRA (r = 8) model exhibited a sharp decrease in entropy for prompt_8, reaching a value of 0. This indicates that all outputs collapsed into a single score or a highly restricted score range, corresponding to a complete distribution collapse from an information-theoretic perspective. For INT4 + QLoRA (r = 16), entropy values were 0 across all prompts, confirming an even more extreme loss of output diversity compared to r = 8.
As shown in Table 7, distribution collapse summary indicators exhibited the same pattern. The Maximum Concentration Ratio (MCR) increased from 0.2631 for BF16 (overall) to 0.9786 for r = 8, while KL divergence and PSI values reached 14.02 and 20.62, respectively, indicating substantial deviation from the reference distribution.
Distribution Shift and Structural Collapse Metrics
Prompt-wise analysis further demonstrated that this concentration phenomenon was not confined to specific prompts but occurred consistently across prompts. Collectively, these results quantitatively demonstrate that accuracy degradation in 4-bit quantized QLoRA-based AES models is not merely due to increased prediction error, but is accompanied by structural collapse in output score distributions, where predictions concentrate into limited score regions. However, whether such distribution collapse can be alleviated through increased learning capacity or stronger learning signals—specifically, through changes in QLoRA rank—could not be determined based on this analysis alone. Accordingly, the subsequent experiment focused on analyzing Disentanglement of Performance Degradation Causes through rank-based comparisons of QLoRA configurations.
4.4 Analysis of Performance Degradation Causes
To verify whether the observed output score distribution collapse resulted from a failure of QLoRA training, comparative experiments were conducted including the BF16(baseline) model, QLoRA models with different ranks (r = 8, r = 16), and an INT4 (Adapter OFF) model in which only quantization was applied without any adapter-based training. The AEC_change_rate metric indicates whether prediction changes actually occurred as a result of training.
As shown in Table 8, the INT4 (Adapter OFF) model exhibited a value of 0.000 across all prompts, whereas all INT4 + QLoRA models showed values greater than zero. This result indicates that learning occurred in the INT4 + QLoRA models but not in the quantization-only condition. Similarly, Δmean(|pred|), which reflects whether the center of the prediction distribution shifted due to learning, was zero only for the INT4 (Adapter OFF) model. This observation suggests that even under quantized conditions, LoRA-based training preserved the learning effect of shifting the distribution center.
Validation of Learning Effects
LoRA_ΔW_norm directly measures the magnitude of actual parameter updates and was consistently observed in INT4 + QLoRA models, demonstrating that low-rank adapter parameters were updated by meaningful amounts. In particular, larger values observed for r = 16 quantitatively indicate that increasing the rank expanded the degree of learning freedom. To further determine whether output collapse reflected learning failure or representational constraints, the relationship between output behavior and input text characteristics was analyzed.
Rank Sensitivity in Table 9 measures how sensitive output rankings are to changes in the input. A common value of 0.160 was observed for INT4 + QLoRA models relative to the BF16(baseline) and INT4 (Adapter OFF) models, indicating that outputs continued to respond to input variations. This result suggests that even under output collapse conditions, the model did not completely ignore input information.
Attribution Analysis Between Input Text Heuristic Properties and Output Representation Collapse
In the Length Corr metric, which measures the correlation between input length and output scores, INT4 + QLoRA models exhibited similarly high positive correlations to those observed in the BF16(baseline) and INT4 (Adapter OFF) models at the overall level. However, at the prompt-wise level, the correlations were unstable or resulted in NaN values. This instability indicates that, under constrained representational capacity, the model fails to maintain consistent responses to specific input factors across prompts.
For the Richness metric, values were observed to increase progressively in the negative direction across model conditions. This trend indicates that as representational capacity becomes more restricted, output quality degrades more severely for inputs with higher lexical diversity. Such behavior quantitatively demonstrates that the observed collapse phenomenon is not attributable to a lack of learning, but is instead associated with saturation and structural constraints in the model’s representational space.
4.5 Integrated Result Analysis
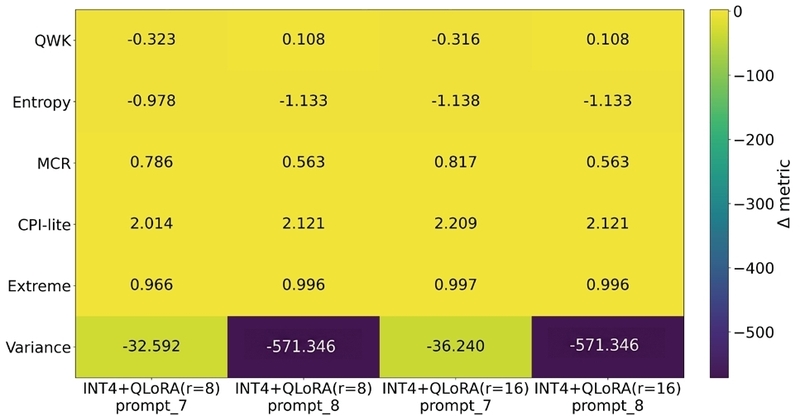
To provide an overview of how output distribution–related indicators differed between INT4 + QLoRA models and the BF16(baseline) model, sensitivity heatmaps were used for visualization (Fig. 5).
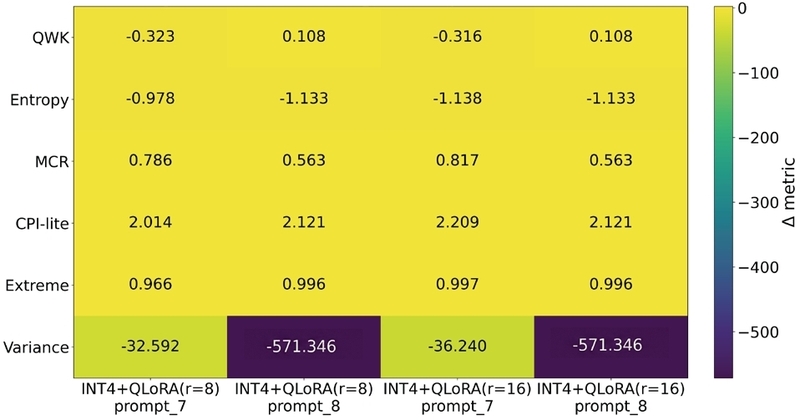
Prompt-wise Sensitivity Map for INT4 Models (Structural Distribution Differences)
The visualization shows that performance degradation observed in INT4 + QLoRA models manifested not as simple accuracy reduction, but as structural changes characterized by output diversity collapse and mode concentration. These distribution collapse patterns appeared repeatedly across prompts and were not fundamentally alleviated by increasing the QLoRA rank.
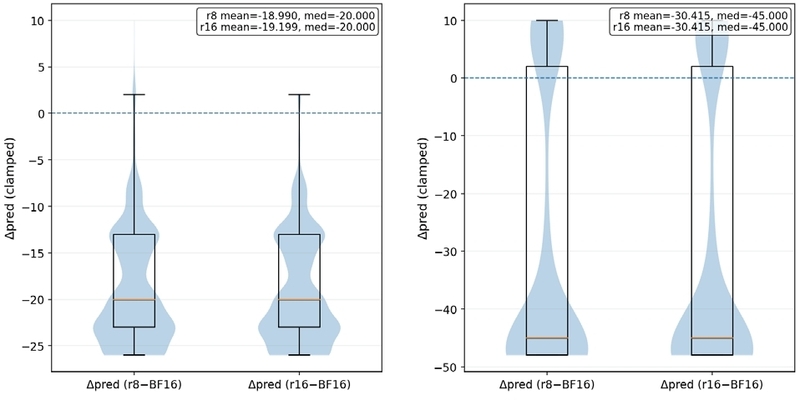
As shown in Fig. 6, the observed output distribution collapse cannot be simply reduced to learning failure. Even in the INT4 environment, LoRA-based fine-tuning was actually performed, and both parameter updates and corresponding shifts in prediction values were confirmed. However, such learning did not act to expand the output distribution, but rather appeared as repeated fine adjustments within an already constrained score space.
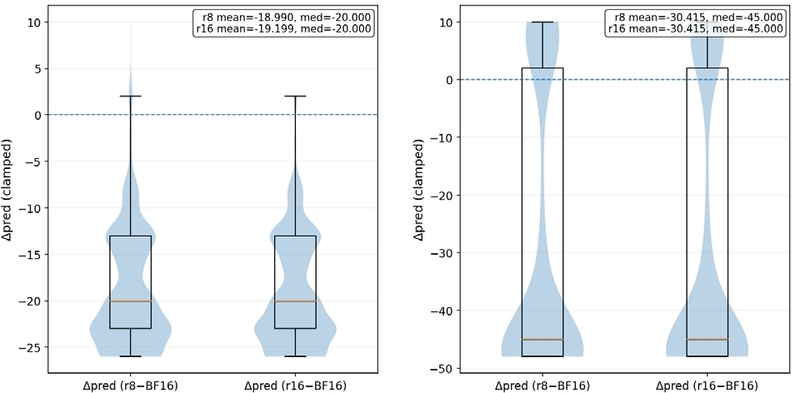
Persistence of Collapse Before and After Adapter Application
Furthermore, these findings suggest that representational constraints inherent to the 4-bit quantization setting induce a reduction in output diversity and a concentration of predictions within narrow score ranges, ultimately leading to structural collapse in the output distribution.
Such changes were consistently observed across multiple indicators, including decreased entropy and variance, along with increased MCR and CPI-lite values, and were clearly distinguishable from variations captured by average accuracy metrics. Taken together, these results can be interpreted as a systematic process in which representational limitations under low-precision quantization drive structural transformations in the output distribution, rather than merely causing uniform performance degradation.
The results of this study should be interpreted within the context of a fine-tuned AES setting. Furthermore, the effects of lightweight adaptation should be considered in conjunction with the characteristics of the underlying data distribution, as their interaction may contribute to output instability rather than arising from quantization alone [3, 12].
4.6 Summary of Statistical Test Results
Table 10 summarizes the results of the Wilcoxon signed-rank tests comparing prediction score differences between the BF16(baseline) model and INT4 + QLoRA models. For the QLoRA (r = 8) model, the p-value was 1.38 × 10- 173, and for the QLoRA (r = 16) model, the p-value was 9.28 × 10- 174. In both cases, the null hypothesis was rejected at the significance level of α = 0.05.
Results of Wilcoxon Signed-Rank Tests and Effect Sizes
Effect sizes, computed using the Vargha–Delaney A statistic, were 0.594 for r = 8 and 0.596 for r = 16, corresponding to medium or higher effect sizes under non-parametric criteria. These statistical results support that the differences observed across Accuracy Performance, Output Stability, Output Distribution Characteristics, and Disentanglement of Performance Degradation Causes analyses are based on systematic effects rather than random variation.
5. Conclusions and Future Work
This study investigated the performance changes observed when applying 4-bit quantized QLoRA models to automated essay scoring (AES), without reducing such changes to a simple decline in average accuracy. Instead, the analysis was organized along four analytical axes—Accuracy Performance, Output Stability, Output Distribution Characteristics, and Disentanglement of Performance Degradation Causes—to enable a systematic and quantitative examination. To this end, comparative experiments were conducted in the ASAP-AES evaluation setting, considering a BF16 baseline model, an INT4 (Adapter OFF) model, and INT4+QLoRA models with ranks r = 8 and r = 16.
The results indicate that, under low-bit (4-bit) conditions, performance changes relative to the BF16 baseline are accompanied not only by variations in average accuracy but also by structural shifts in output stability and score distribution characteristics. These findings suggest that the performance of lightweight AES models cannot be adequately explained by average accuracy metrics alone, and that a comprehensive understanding requires jointly considering the output generation process and the resulting distributional structure.
The most important implication of this study is the empirical demonstration that evaluating the performance of lightweight LLM-based AES systems solely through average accuracy metrics is insufficient. As AES is an ordinal score prediction task, the stability and structural properties of output score distributions play a central role in determining model reliability.
In the context of deploying AES systems in real educational settings, these findings clearly indicate that accuracy-centered evaluation alone cannot guarantee educational validity. As observed in the experimental results, some lightweight models failed to maintain satisfactory performance even under QWK-based evaluation and exhibited distributional collapse in which predicted scores were excessively concentrated on specific values. Such behavior may lead to assessment outcomes that fail to reflect learners’ actual achievement levels in a fine-grained manner, and may conflict with the goals of constructed-response assessment, which requires continuous and multidimensional judgment of performance.
Accordingly, this study proposes that, prior to deploying lightweight AES models in educational practice, minimum validation procedures for output distribution stability should be performed, for example by incorporating distribution-based indicators such as the Collapse Probability Index (CPI). Such procedures should be regarded as essential safeguards for balancing computational efficiency with educational reliability. Ultimately, these findings underscore the need for a shift in evaluation criteria for practical AES deployment, from a sole focus on “how accurate” a model is toward a more comprehensive consideration of “how stable and fair” its outputs are. This shift may serve as an important reference point for the future design of AI-based educational assessment systems.
The analytical framework proposed in this study is not limited to AES, but can be extended to other ordinal generation tasks, including ranking prediction and score regression, thereby contributing to a more precise assessment of the applicability and limitations of lightweight models.
However, the findings of this study are based on experiments conducted under a specific configuration, centered on a particular base model (Mistral-7B), a specific lightweight setting (4-bit QLoRA), and a low-rank adaptation regime (r = 8 and r = 16). Therefore, the observed phenomena should be primarily interpreted within the context of this representative open-model and lightweight adaptation combination [1, 3, 10–12]. In addition, as this study was conducted using models directly fine-tuned on the ASAP-AES dataset, the observed distribution collapse may reflect not only the effects of lightweight adaptation itself, but also its interaction with the underlying data distribution. From this perspective, the main contribution of this study lies in empirically demonstrating that, when applying lightweight LLMs to AES, it is necessary to consider not only average performance metrics but also data distribution characteristics and output stability [3, 12].
For future work, several directions are suggested. First, cross-validation is needed to examine whether similar distribution collapse patterns arise across different open LLMs, such as Qwen and LLaMA, as well as alternative quantization strategies including AWQ and GPTQ [1, 12, 25, 26]. Second, comparisons with publicly available QLoRA models trained on general-purpose datasets would help determine whether the observed phenomena are specific to directly fine-tuned AES settings or reflect more general tendencies [3, 12]. Third, additional sensitivity analyses are required to assess whether the results obtained under deterministic decoding conditions remain consistent when varying temperature and sampling parameters [12]. Fourth, extending the analysis to higher-rank configurations (e.g., r = 32 and r = 64) would provide further insight into how expanding the low-rank regime affects output distribution stability [20-22]. Through these follow-up investigations, it will be possible to more precisely characterize both the applicability and the limitations of lightweight LLMs in real-world educational assessment settings.
Acknowledgments
본 논문은 제1저자의 서울과학종합대학원대학교 석사학위논문 일부를 발췌하여 요약, 정리한 것임.
References
- Huang, Y., & Wilson, J. (2025). Evaluating LLM-based automated essay scoring: Accuracy, fairness, and validity. In Proceedings of the Artificial Intelligence in Measurement and Education Conference (AIME-Con): Works in Progress, 71-83. https://aclanthology.org/2025.aimecon-wip.9/
-
Li, H., Chen, C.-H., Fan, K., Young-Johnson, C., Lim, S., & Feng, Y. (2025). Agreement between large language models and human raters in essay scoring: A research synthesis. arXiv preprint arXiv:2512.14561, .
[https://doi.org/10.48550/arXiv.2512.14561]

-
Abujadallah, M., Saad, M., & Abudalfa, S. (2025). Evaluating open-source LLMs for automated essay scoring: The critical role of prompt design. Preprints.
[https://doi.org/10.20944/preprints202511.1429.v1]
-
Binotto, G., & Delgado, R. (2025). Adapting performance metrics for ordinal classification to interval scale: Length matters. Machine Learning, 114, Article 41.
[https://doi.org/10.1007/s10994-024-06654-4]
-
Doewes, A., Kurdhi, N. A., & Saxena, A. (2023). Evaluating quadratic weighted kappa as the standard performance metric for automated essay scoring. In Proceedings of the 16th International Conference on Educational Data Mining, 103-113.
[https://doi.org/10.5281/zenodo.8115784]
-
Dettmers, T., Pagnoni, A., Holtzman, A., & Zettlemoyer, L. (2023). QLoRA: Efficient finetuning of quantized LLMs. arXiv preprint arXiv:2305.14314, .
[https://doi.org/10.48550/arXiv.2305.14314]
-
Liu, Y., Meng, Y., Wu, F., Peng, S., Yao, H., Guan, C., Tang, C., Ma, X., Wang, Z., & Zhu, W. (2024). Evaluating the generalization ability of quantized LLMs: Benchmark, analysis, and toolbox. arXiv preprint arXiv:2406.12928, .
[https://doi.org/10.48550/arXiv.2406.12928]
-
Jin, R., Du, J., Huang, W., Liu, W., Luan, J., Wang, B., & Xiong, D. (2024). A comprehensive evaluation of quantization strategies for large language models. In Findings of the Association for Computational Linguistics: ACL 2024, 12186-12215.
[https://doi.org/10.18653/v1/2024.findings-acl.726]
-
Duym, J., Oramas Mogrovejo, J. A., & Anwar, A. (2025). Quantifying generative stability: Mode collapse entropy score for mode diversity evaluation. In Proceedings of the Winter Conference on Applications of Computer Vision Workshops, 187-196.
[https://doi.org/10.1109/WACVW65960.2025.00025]
- Mistral AI. (2023, September 27). Mistral 7B. https://mistral.ai/news/announcing-mistral-7b
-
Jiang, A. Q., Sablayrolles, A., Mensch, A., Bamford, C., Chaplot, D. S., de las Casas, D., Bressand, F., Lengyel, G., Lample, G., Saulnier, L., Renard Lavaud, L., Lachaux, M.-A., Stock, P., Le Scao, T., Lavril, T., Wang, T., Lacroix, T., & El Sayed, W. (2023). Mistral 7B. arXiv preprint arXiv:2310.06825, .
[https://doi.org/10.48550/arXiv.2310.06825]
-
Xue, M., Xiao, X., Liu, Y., & Wilson, M. (2026). On the consistency of automatic scoring with large language models. Educational and Psychological Measurement. Advance online publication.
[https://doi.org/10.1177/00131644261418138]
-
Li, S., & Ng, V. (2024). Automated essay scoring: Recent successes and future directions. In Proceedings of the Thirty-Third International Joint Conference on Artificial Intelligence, 8114-8122.
[https://doi.org/10.24963/ijcai.2024/897]
- Xu, Y., Xie, L., Gu, X., Chen, X., Chang, H., Zhang, H., Chen, Z., Zhang, X., & Tian, Q. (2024). QA-LoRA: Quantization-aware low-rank adaptation of large language models. In International Conference on Learning Representations. https://openreview.net/forum?id=WvFoJccpo8
-
Proskurina, I., Brun, L., Metzler, G., & Velcin, J. (2024). When quantization affects confidence of large language models? In Findings of the Association for Computational Linguistics: NAACL 2024, 1918-1928.
[https://doi.org/10.18653/v1/2024.findings-naacl.124]
-
Zhao, Y., Lin, C.-Y., Zhu, K., Ye, Z., Chen, L., Zheng, S., Ceze, L., Krishnamurthy, A., Chen, T., & Kasikci, B. (2023). Atom: Low-bit quantization for efficient and accurate LLM serving. arXiv preprint arXiv:2310.19102, .
[https://doi.org/10.48550/arXiv.2310.19102]
-
Elhoushi, M., & Johnson, J. (2025). any4: Learned 4-bit numeric representation for LLMs. arXiv preprint arXiv:2507.04610, .
[https://doi.org/10.48550/arXiv.2507.04610]
-
Atkinson, J., & Palma, D. (2025). An LLM-based hybrid approach for enhanced automated essay scoring. Scientific Reports, 15(1), Article 14551.
[https://doi.org/10.1038/s41598-025-87862-3]
-
Hou, Z. J., Ciuba, A., & Li, X. L. (2025). Improve LLM-based automatic essay scoring with linguistic features. arXiv preprint arXiv:2502.09497, .
[https://doi.org/10.48550/arXiv.2502.09497]
-
Hu, E. J., Shen, Y., Wallis, P., Allen-Zhu, Z., Li, Y., Wang, S., Wang, L., & Chen, W. (2021). LoRA: Low-rank adaptation of large language models. arXiv preprint arXiv:2106.09685, .
[https://doi.org/10.48550/arXiv.2106.09685]
- Wang, Z., Liang, J., He, R., Wang, Z., & Tan, T. (2025). LoRA-Pro: Are low-rank adapters properly optimized? In International Conference on Learning Representations. https://openreview.net/forum?id=gTwRMU3lJ5
- Zhou, H., Lu, X., Xu, W., Zhu, C., Zhao, T., & Yang, M. (2025). LoRA-drop: Efficient LoRA parameter pruning based on output evaluation. In Proceedings of the 31st International Conference on Computational Linguistics, 5530-5543. https://aclanthology.org/2025.coling-main.371/
- Ravindran, R., & Choi, I. (2025). Investigating adversarial robustness in LLM-based AES. In Proceedings of the Artificial Intelligence in Measurement and Education Conference (AIME-Con): Coordinated Session Papers, 86-91. https://aclanthology.org/2025.aimecon-sessions.10/
-
AlGhamdi, E. M., Li, Y., Gašević, D., & Chen, G. (2026). Leveraging prompt-based LLMs for automated scoring and feedback generation in higher education. Computers & Education, 243, 105511.
[https://doi.org/10.1016/j.compedu.2025.105511]
-
Lin, J., Tang, J., Tang, H., Yang, S., Chen, W.-M., Wang, W.-C., Xiao, G., Dang, X., Gan, C., & Han, S. (2023). AWQ: Activation-aware weight quantization for LLM compression and acceleration. arXiv preprint arXiv:2306.00978, .
[https://doi.org/10.48550/arXiv.2306.00978]
-
Frantar, E., Ashkboos, S., Hoefler, T., & Alistarh, D. (2022). GPTQ: Accurate post-training quantization for generative pre-trained transformers. arXiv preprint arXiv:2210.17323, .
[https://doi.org/10.48550/arXiv.2210.17323]
Appendix
Appendix
Portions of the manuscript text were developed with the auxiliary use of ChatGPT 5.2 for improving readability and drafting sentence-level expressions, and the author completed the final revision.
<Experimental Settings Applied for Comparative Evaluation>
All inference experiments were conducted under a fully deterministic decoding configuration, in which sampling was explicitly disabled. Specifically, a greedy decoding strategy was uniformly applied across all model conditions to ensure deterministic outputs and to eliminate variability arising from stochastic generation.
- do_sample = False
- temperature = 0.0
- num_beams = 1
- max_new_tokens = 16
- pad_token_id = eos_token_id = tokenizer.eos_token_id
- truncation = True
- padding = "max_length"
- max_length = 1024
- tokenizer.pad_token = tokenizer.eos_token
- During model loading: torch_dtype = torch.bfloat16
- For QLoRA 4-bit quantized computation: bnb_4bit_compute_dtype = torch.bfloat16
- During training (TrainingArguments): fp16 = False, F16(baseline)=True/ BF16(baseline) Experiments were configured to terminate immediately in environments that do not support BF16 for the baseline model.
Model lightweighting was implemented using bnb_config = BitsAndBytesConfig(···).
The detailed configuration is as follows:
- Quantization method: 4-bit QLoRA
- Quantization format: bnb_4bit_quant_type = "nf4"
- Double quantization: bnb_4bit_use_double_quant = True
- Quantized computation precision: bnb_4bit_compute_dtype = torch.bfloat16 (fixed to BF16 baseline)
- Loading option: load_in_4bit = True
Fine-tuning was performed using a parameter-efficient fine-tuning approach, in which only LoRA adapters were trained without updating the full model parameters. The LoRA configuration was implemented using LoraConfig(···), as specified below.
- LoRA rank: r ∈ {8, 16}
- LoRA alpha: lora_alpha = 2 * r
- LoRA dropout: lora_dropout = 0.10
- bias: bias = "none"
- task type: task_type = "CAUSAL_LM"
- target_modules = ["q_proj","k_proj","v_proj", "o_proj","gate_proj","up_proj","down_proj"]
Training hyperparameters were implemented using TrainingArguments(···).
The detailed settings are as follows.
- Epoch: 3
- Learning Rate: LR_GRID = [5e-5, 1e-4, 2e-4]
- per_device_train_batch_size = 2
- gradient_accumulation_steps = 4: 2(per_device_bs) X 4=8)
- warmup_ratio = 0.05
- weight_decay = 0.01
- max_grad_norm = 1.0
- optim = "paged_adamw_8bit"
- evaluation_strategy = "steps"
- eval_steps = 500
- Optimizer: AdamW
- Max sequence length: 1024 tokens
- Precision flag: BF16(baseline)
<Korean version of Tables and Figures>
실험 조건 및 비교 세트
정확도 결과 요약
프롬프트 민감도 분석-QWK_macro
QA Gate 진단 결과
출력 안정성 및 재시도 진단
출력 다양성 지표
분포 왜곡 및 붕괴 지표
학습 효과 검증
입력 텍스트 휴리스틱 특성과 출력 붕괴 간 속성 분석
통계 검정 결과
정확도 성능 비교
프롬프트별 정확도 이질성
점수 범위 이탈 및 클램핑 영향 모델별 비교
Raw와 Clampled의 정확도 관계
프롬프트별 INT4 민감도 지도(구조적 분포 차이 비교)
어댑터 적용 전후 붕괴 지속성

· 1997년 이화여자대학교(문학사/경영학사)
· 2026년 서울과학종합대학원대학교 AI빅데이터전공(공학석사)
· 2026년 SDG School(eMBA)
· 2019년~현재 AI 컴퓨터 교육
관심분야 : 교과교육, AI, 피지컬컴퓨팅
espilmin@stud.assist.ac.kr

· 2000년 조선대학교 컴퓨터공학과(공학사)
· 2022년 고려대학교 디지털융합금융학과(공학석사)
· 2025년 서울과학종합대학원대학교 경영학과 (경영학박사)
· 2025년~현재 서울과학종합대학원 객원교수
· 2025년~현재 산업정책연구원 연구교수
관심분야 : AI 융합, 시계열 분석, 빅데이터분석
nhjung@assist.ac.kr